Portfolio Comparison: January 2012

January was a great month for stocks. It feels good to say that, as it hasn’t been an incredibly common sentiment in recent months. In this monthly comparison, however, we still don’t even have a single year’s worth of data, so drawing any conclusions is a little premature. Still, there are some interesting things to note, so let’s start by looking at the data:

Portfolio Last Month This Month % Chg Total Gain CAGR
Decision Moose $105276.92 $105267.37 -0.009% +$5267.37 +8.161%
Magic Formula $94968.53 $103262.72 +8.734% +$3262.72 +5.029%
U.S. Market $97637.07 $102586.05 +5.069% +$2586.05 +3.979%
Permanent Portfolio $95535.20 $102129.42 +6.902% +$2129.42 +3.272%
Caribou $101948.78 $101612.45 -0.330% +$1612.45 +2.475%
Precious Metals $87913.07 $101552.96 +15.515% +$1552.96 +2.383%
Savings Account $100544.85 $100613.41 +0.068% +$613.41 +0.939%
Skunks of the Dow $88038.80 $99865.19 +13.433% -$134.81 -0.206%
Mechanical Blend $84344.78 $87103.61 +3.271% -$12896.39 -19.023%
Sector Flow $76669.31 $80734.64 +5.302% -$19265.36 -27.895%

There were only two failures in January: Decision Moose and Caribou. Since they were both invested in bonds for the month, we can draw the conclusion that bonds were not the place to be. Since I believe both portfolios were in TLT for the entire month, I initially had no idea why they didn’t have the same percentage gain. After doing some research, however, it looks like Decision Moose benefited from the receipt of a dividend early in the month that Caribou missed. So, with our failures out of the way, let’s talk about what did work.

Making tremendous gains this month was the Precious Metals portfolio, which recouped December’s losses and then some. Of course, this still only averages out to a paltry CAGR of 2.3%, but I suppose it’s better than nothing. More important, there are only two non-savings account portfolios which aren’t beating this important benchmark.

The rest of the portfolios all had varying gains from good to fantastic. It was a good month for stocks overall, and in the end, it came down to little more than holding the right stocks. Most portfolios are now above zero or at least close to it. The two remaining stragglers are the Mechanical Blend and Sector Flow portfolios. As we’ve seen, however, things can change in an instant, so don’t count either of these two portfolios out. (I still consider them two of the most likely portfolios to be on top after several years.)

For a slight change of pace, I’m actually making this post in advance of the rebalancing date, which is Monday, February 6. Changes this month are few and far in between, but the Magic Formula portfolio will be adding PERI and TNAV. The Mechanical Blend portfolio will shift around as usual, of course. The rest of the portfolios will be merely rebalancing. (This monthly update kind of masks the fact that Decision Moose, Caribou, and Sector Flow can signal changes every week.)

Disclaimer: This post is a description of my own forays into investing, offered as general market commentary, and should not be construed as investment advice or the recommendation of a particular security over any other.

Portfolio Comparison: December 2011

The time has come for yet another monthly update to my portfolio comparison that I began several months ago: choosing ten different potential investment strategies, throwing them into the pit, and letting them duke it out until someone emerged victorious over its brethren. We’re only a few short months into this contest, however, and with the kind of swings a single month can bring, we’re nowhere close to being able to crown a winner. I’m not sure such a thing will ever be possible.

Looking generally at the results of the last month, however, we can make a few small points: Some portfolios were up and some were down, but overall, it was largely a month of staying right where we started. I’m sure I could contort that into some sort of holiday-themed message, but I probably missed the boat on that one. Let’s begin this month’s comparison by looking at the raw data:

Portfolio Last Month This Month % Chg Total Gain CAGR
Decision Moose $102099.43 $105276.92 +3.112% +$5276.92 +9.498%
Caribou $103780.04 $101948.78 -1.765% +$1948.78 +3.464%
Savings Account $100472.30 $100544.85 +0.072% +$544.85 +0.959%
U.S. Market $96742.61 $97637.07 +0.925% -$2362.93 -4.132%
Permanent Portfolio $98965.09 $95535.20 -3.466% -$4464.80 -7.743%
Magic Formula $92961.48 $94968.53 +2.159% -$5031.47 -8.706%
Skunks of the Dow $87293.84 $88038.80 +0.853% -$11961.20 -20.131%
Precious Metals $101329.87 $87913.07 -13.241% -$12086.93 -20.332%
Mechanical Blend $83903.57 $84344.78 +0.526% -$15655.22 -25.949%
Sector Flow $76179.71 $76669.31 +0.643% -$23330.69 -37.422%

A clear (if boring) trend seems to have emerged on the chart: almost nothing has happened in the past three months. This is hardly a trend that’s going to fatten anyone’s wallet. The last month was a microcosm of the last quarter, with a largely uneventful set of changes. Of course, there was a single exception, but more on that in a paragraph of three. Let’s quickly run down this past month’s results:

  • Continuing to lead the way at the top are the Caribou and Decision Moose portfolios. Caribou spent some time in gold, but eventually returned to the safety of bonds, where Decision Moose has found its home recently. Decision Moose was up somewhat, and Caribou ultimately fell, but they’re still beating all the benchmarks, and that’s all we can ask for, I suppose.
  • In third place, we find the simple ING Direct Orange savings account, which despite reducing its interest rate once again, continues to taunt the stock-based strategies which find themselves in a deep hole.
  • It wasn’t all bad for stocks, however, as all of the stock-based strategies found a way to make up some ground. The gains weren’t impressive, but at least they resulted in that nice green color.
  • The Permanent Portfolio and Precious Metals portfolios both lost ground in December, unfortunately. The metals perilously so, dropping an impressive 13% in a single month. We could really use Burl Ives right about now, what with Silver and Gold floundering this Christmas season.

Once again this month, the post follows the rebalancing, which occurred on Tuesday. The Magic Formula portfolio added KLIC and DELL, the Mechanical Blend portfolio had several socks move in and out, and the rest of the portfolios merely rebalanced.

Disclaimer: This post is a description of my own forays into investing, offered as general market commentary, and should not be construed as investment advice or the recommendation of a particular security over any other.

Portfolio Comparison: November 2011

Halloween may have been a bust, with October being one of the least scary investing months this year. However, there was little to be thankful for in November, with most portfolios taking a hit, to put it mildly. Still, despite the overall atmosphere of loss, there are some clear spots in this cloudy sky. A few portfolios actually saw a rise, and perhaps more important, the end of the month saw stocks begin to climb again. Whether that trend will continue or not, no one can say.

In any case, let’s start by looking at the data for last month:

Portfolio Last Month This Month % Chg Total Gain CAGR
Caribou $101759.31 $103780.04 +1.986% +$3780.04 +7.957%
Decision Moose $100111.42 $102099.43 +1.986% +$2099.43 +4.381%
Precious Metals $102765.04 $101329.87 -1.397% +$1329.87 +2.764%
Savings Account $100398.36 $100472.30 +0.074% +$472.30 +0.977%
Permanent Portfolio $100314.92 $98965.09 -1.346% -$1034.91 -2.124%
U.S. Market $97082.88 $96742.61 -0.350% -$3257.39 -6.605%
Magic Formula $95464.23 $92961.48 -2.622% -$7038.52 -13.981%
Skunks of the Dow $93456.09 $87293.84 -6.594% -$12706.16 -24.453%
Mechanical Blend $87739.07 $83903.57 -4.371% -$16096.43 -30.382%
Sector Flow $76675.52 $76179.71 -0.647% -$23820.29 -42.961%

If you look at the shape of the curves in the graph, you can see that the second half of the month was mostly spent making up for the losses experienced in the first half. Three portfolios had different tracks, however, so let’s take a look at the individual results:

  • Leading the way in the comparison are the Caribou and Decision Moose portfolios, which are based on similar methodologies. Their advantage this month can largely be attributed to their holding of TLT, an ETF invested in long-term bonds. However, as bonds have receded in the past couple of weeks, so have these portfolios. Nonetheless, their performance is good enough to keep them in first and second place, respectively.
  • The precious metals didn’t fare nearly as well, following the overall equities track for the month: falling early, and subsequently rising, ending the month with a small loss. Excellent performance in previous months has kept the metals high in the comparison.
  • Next in the list is the savings account, which as you might suspect, earns paltry sub-1% interest at the moment. Despite this, it’s in fourth place, which speaks to how poorly stocks have been doing in recent months. It’s worth noting that Caribou and Decision Moose are currently the only portfolios beating all three of my benchmarks (U.S. Market, Savings Account, and Precious Metals).
  • In fifth place, we find the Permanent Portfolio, which ultimately went slightly negative after this month’s results.
  • Rounding out the bottom are the five stock-based portfolios in the comparison. It’ll be interesting to see if they can make up some ground over the next few months.

This post is somewhat late this month, as the rebalance date was two days ago, on Monday. The Magic Formula portfolio added MNTA and VG. The Mechanical Blend portfolio had several stocks swap in and out as usual. The rest of portfolios didn’t end up changing much at all, beyond rebalancing.

Disclaimer: This post is a description of my own forays into investing, offered as general market commentary, and should not be construed as investment advice or the recommendation of a particular security over any other.

Portfolio Comparison: October 2011

During August and September, investors were finding themselves in the doghouse. I don’t mean a nice doghouse you might find in a suburban community. No, I’m talking more about the kind of doghouse you’d be horrified to discover in some kind of unholy alliance between Alfred Hitchcock and Tim Burton. The kind of doghouse that gives nightmares nightmares. Still, today, here in early November, we can look back on October with a gasp of relief, as we see that it really wasn’t all that bad. In fact, people who hopped into the market at the beginning of the month are probably patting themselves on their backs right about now.

Let’s explore this decidedly last ghastly month, beginning with the usual data:

Portfolio Last Month This Month % Chg Total Gain CAGR
Precious Metals $92784.58 $102765.04 +10.757% +$2765.04 +7.012%
Caribou $98941.93 $101759.31 +2.848% +$1759.31 +4.429%
Savings Account $100316.58 $100398.36 +0.082% +$398.36 +0.993%
Permanent Portfolio $93722.84 $100314.92 +7.034% +$314.92 +0.784%
Decision Moose $105037.21 $100111.42 -4.690% +$111.42 +0.277%
U.S. Market $87332.72 $97082.88 +11.164% -$2917.12 -7.092%
Magic Formula $86122.56 $95464.23 +10.847% -$4535.77 -10.893%
Skunks of the Dow $84728.61 $93456.09 +10.301% -$6543.91 -15.478%
Mechanical Blend $75384.15 $87739.07 +16.389% -$12260.93 -27.747%
Sector Flow $70473.51 $76675.52 +8.800% -$23324.48 -48.309%

In a definite contrast to last month, only one portfolio wasn’t positive: the Decision Moose portfolio. Everything else had varying degrees of success, so here’s the quick rundown:

  • Both silver and gold had good months, meaning the Precious Metals portfolio also did well, ultimately pushing the portfolio into first place in this comparison.
  • With most of the market screaming upward, bonds took the fall on the other side of the coin, leaving the bond-heavy portfolios such as Caribou and Decision Moose lagging behind their stock counterparts. Nonetheless, their excellent performance several months ago has kept them in second and fifth place, respectively. Of course, if they continue to lag behind much longer, this distinction will undoubtedly no longer apply.
  • In third place, we find the simple ING Direct Savings Account portfolio, continuing to trudge along at its paltry interest rate of nearly 1%. (ING lowered the rate during the month, leading the CAGR to drop below 1%.) In fourth place comes the Permanent Portfolio, which may as well be a savings account on steroids. Again, it trades a bit of volatility for (hopefully) better returns.
  • Looking toward the bottom five, we find all five of the stock-based portfolios in the comparison. Granted, stocks had an excellent month, and this is reflected in the data. However, their absolutely abysmal performance in previous months has left them with quite a bit more ground to make up. It’s interesting to note that the best-performing stock portfolio is the U.S. Market. Trying to beat the market with all kinds of formulas and screens just isn’t cutting it at the moment. Perhaps it never will.

I have been incredibly lazy about finally getting this post written, so the rebalance date is, in fact, today. On the plus side, this means I already have determined what each of the portfolios will be doing. The Magic Formula portfolio will be adding CPLA and LMLP. Nothing is changing in the Skunks of the Dow portfolio, and the rest of the portfolios will be merely rebalanced. Both Caribou and Decision Moose have been in TLT for a few weeks, and haven’t signaled a change this week.

Disclaimer: This post is a description of my own forays into investing, offered as general market commentary, and should not be construed as investment advice or the recommendation of a particular security over any other.
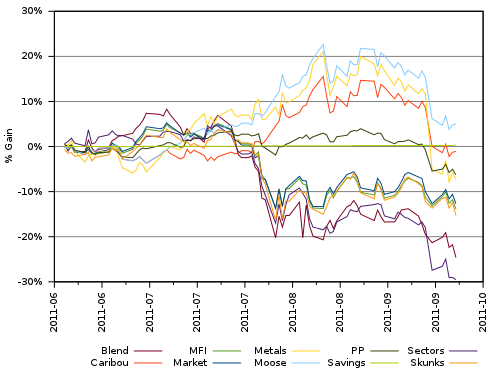
Portfolio Comparison: September 2011

It seems like every month when I’m writing these updates, I think to myself, “Well, at least it can’t get any worse.” Apparently, I was wrong. It did get worse, ladies and gentlemen: a lot worse. In fact, my recommendation for people reading this post is to accidentally close the window and come back next month when the results are bound to be much rosier. (Don’t worry, those won’t prove to be famous last words or anything.)

For those of you who are interested in the gruesome details, however, let’s begin with the table and chart:

Portfolio Last Month This Month % Chg Total Gain CAGR
Decision Moose $118102.07 $105037.21 -11.062% +$5037.21 +16.735%
Savings Account $100234.61 $100316.58 +0.082% +$316.58 +1.000%
Caribou $111248.64 $98941.93 -11.062% -$1058.07 -3.294%
Permanent Portfolio $103559.12 $93722.84 -9.498% -$6277.16 -18.464%
Precious Metals $115741.79 $92784.58 -19.835% -$7215.42 -21.006%
U.S. Market $94424.74 $87332.72 -7.511% -$12667.28 -34.719%
Magic Formula $93311.64 $86122.56 -7.704% -$13877.44 -37.525%
Skunks of the Dow $94128.60 $84728.61 -9.986% -$15271.39 -40.654%
Mechanical Blend $88026.39 $75384.15 -14.362% -$24615.85 -58.923%
Sector Flow $85703.74 $70473.51 -17.771% -$29526.49 -66.773%

As you can see, exactly one portfolio didn’t lose at least seven percent: the plain vanilla savings account. Everything else took a long walk off a very short pier. Here’s a quick rundown of the various portfolios:

  • Although it was incredibly bad month for the precious metals, their previous run up has left them somewhat closer to neutral than other asset classes. As a result, portfolios such as Decision Moose, Caribou, and (obviously) Precious Metals all rank near the top of the comparison, no thanks to the performance of gold and silver this month. The Precious Metals portfolio itself lost nearly 20% of its value, so these results are nothing to write home about. In fact, only the Decision Moose portfolio is even still positive.
  • Also near the top is the Savings Account portfolio, which has the distinction of being the second portfolio with a positive value. In short, it appears cash was the definitely the place to be over the last month. (Actually, bonds appear to have also done well.)
  • The other portfolio in the top five, the Permanent Portfolio, is diversified into several asset classes including stocks, bonds, and precious metals, which seems to have protected it to some degree, but it still lost nearly 10%.
  • With the top five portfolios taken care of, let’s look instead to the bottom five, all of which are stock-based portfolios. The performances ranged from bad to worse, and I’m finding it hard to find much to say about them at all. Despite their overall low position in the rankings, the U.S. Market and Magic Formula portfolios actually had the second and third best performances in September in this comparison. Let’s hope next month is much more impressive.

The rebalance date here in October will be today, Monday, October 3rd. The Magic Formula portfolio will be adding ASTX and AFAM.  The Skunks of the Dow portfolio will replace INTC with MSFT. Hopefully those two don’t flip-flop positions every month.

Disclaimer: This post is a description of my own forays into investing, offered as general market commentary, and should not be construed as investment advice or the recommendation of a particular security over any other.

Portfolio Comparison: August 2011

If you’ve been paying attention to the markets at all during the last month, you’re no doubt aware that it wasn’t a month as much as it was a bloodbath. Portfolios with stocks as their basis were (figuratively) decimated. It’s going to take an excellent month or two to make this comparison look like anything other than an advertisement for various precious metals. Nonetheless, we’re still several months or years away from being able to make any useful judgments about the various portfolios, so for the moment, let’s just take the data for what it’s worth.

Here’s my famous table and chart:

Portfolio Last Month This Month % Chg Total Gain CAGR
Decision Moose $105190.06 $118102.07 +12.275% +$18102.07 +102.711%
Precious Metals $107005.58 $115741.79 +8.164% +$15741.79 +86.056%
Caribou $99085.90 $111248.64 +12.275% +$11248.64 +57.258%
Permanent Portfolio $102743.73 $103559.12 +0.794% +$3559.12 +16.013%
Savings Account $100149.98 $100234.61 +0.085% +$234.61 +1.000%
U.S. Market $100301.85 $94424.74 -5.859% -$5575.26 -21.623%
Skunks of the Dow $100806.67 $94128.60 -6.625% -$5871.40 -22.662%
Magic Formula $100603.26 $93311.64 -7.248% -$6688.36 -25.472%
Mechanical Blend $97527.89 $88026.39 -9.742% -$11973.61 -41.820%
Sector Flow $98350.13 $85703.74 -12.859% -$14296.26 -48.066%

Gazing at this data, one thing becomes mightily apparent: the poor investor who took stock in stocks this month, might have instead wished to be held in some sort of stockade, just to avoid the terrible news. Here I thought last month was a massacre. Here’s the long and short of it (mostly the short):

  • Sitting atop the comparison, with varying degrees of ridiculous success are the Precious Metals, Caribou, and Decision Moose portfolios, all of which were invested in precious metals of some sort or another this past month. Gold actually outperformed silver, so the Precious Metals portfolio itself didn’t do quite as well as the other two, but anyone holding metals at this point has a big grin on her face, I’m sure.
  • For those of us who prefer the middle ground, both the Permanent Portfolio and Savings Account portfolios are holding steady. Remember, the primary concept behind this particular version of the Permanent Portfolio is to earn a slightly higher return, at the expense of increased volatility. So far, it hasn’t disappointed. The Savings Account portfolio continues to chug away at its astonishingly impressive 1.000% CAGR.
  • Meanwhile, exploring the darkest depths of the Mariana Trench, we find the five stock-based portfolios, ending this past month with varying degrees of epic fail. Sector Flow eventually moved into gold stocks, but not before it suffered at the hands of the rest of the market. Actually, I’m not even sure how well gold stocks have been doing. They are a funny bunch, reacting both to the price of gold and the movement of the market. None of the other portfolios did particularly well either, with larger companies seemingly experiencing less drawdown. Still, this was one month I’d rather have back.

This month’s portfolio rebalance date will be Tuesday, September 6th, as Monday is a holiday. I haven’t yet determined exactly what’s going to happen with each of the portfolios, but I will either update this post or post again with this month’s updates once I’ve figured it all out.

UPDATE: As far as the Magic Formula portfolio goes, it appears that the two new picks for this month are USMO and VECO. Meanwhile, in the Skunks of the DOW portfolio, MSFT and MRK are being replaced with GE and INTC. The rest of the portfolios will be rebalanced as specified in their descriptions.

Disclaimer: This post is a description of my own forays into investing, offered as general market commentary, and should not be construed as investment advice or the recommendation of a particular security over any other.

Portfolio Comparison: July 2011

That’s right, folks. It’s time yet again for another monthly update. Of course, with only two months behind us in this new comparison, the results remain mostly uninformative. I suspect the data will be far more interesting in the months to come.

Once again, I would personally hold off on making any judgments whatsoever about the effectiveness of the following strategies until at least a year of data is available. Honestly, I’d prefer to wait three years, but three years is a long time on the Internet, and who’s to say what will have changed by then? In any case, here’s the table and chart for this month. An attempt at commentary follows, as usual.

Portfolio Last Month This Month % Chg Total Gain CAGR
Precious Metals $95893.45 $107005.58 +11.588% +$7005.58 +59.460%
Decision Moose $97023.52 $105190.06 +8.417% +$5190.06 +41.722%
Permanent Portfolio $99682.48 $102743.73 +3.071% +$2743.73 +20.506%
Skunks of the Dow $101495.03 $100806.67 -0.678% +$806.67 +5.693%
Magic Formula $102329.74 $100603.26 -1.687% +$603.26 +4.232%
U.S. Market $102891.18 $100301.85 -2.517% +$301.85 +2.099%
Savings Account $100065.42 $100149.98 +0.085% +$149.98 +1.000%
Caribou $97023.52 $99085.90 +2.126% -$914.10 -6.132%
Sector Flow $101308.24 $98350.13 -2.920% -$1649.87 -10.832%
Mechanical Blend $105783.41 $97527.89 -7.804% -$2472.11 -15.844%

My, how things can change in a month. What had previously been down was remarkably up, and what had been up took a short walk off a long cliff. Let’s dissect this massacre in detail:

  • Sitting easily atop the rest of the portfolios is the precious metals portfolio. It was a mediocre month for stocks, but gold and silver more than picked up the slack, gaining over 11% in a single month. For reference, that’d be a CAGR of approximately 250%. Of course, the real question here is how much of that was speculation and how much was devaluation of the U.S. dollar? No matter the case, it’s not a good sign that one of our benchmark portfolios is perched at the top.
  • Decision Moose, camping safely in gold all month, benefited from the precious metals surge, leading it to take second place in this comparison. Caribou, spending most of the month in gold, began to recoup some of its losses from the previous month.
  • The Permanent Portfolio did relatively well, vaulting itself into third place. Of course, since I consider this strategy only slightly better than a savings account, it again does not bode well for the remaining portfolios. Speaking of the savings account, it trudged ahead at its predictable rate of return.
  • Three stock-based portfolios (Skunks of the Dow, the Magic Formula, and the overall U.S. Market) all had mediocre weeks, finishing slightly down, though still above the savings account.
  • Finally, neither the Sector Flow nor the Mechanical Blend portfolio did very well at all. In fact, they both did downright atrociously. With any luck, they’ll make up some of that ground next month. Going from first to last is a long way to fall, but at this early point in the comparison, I wouldn’t worry about it too much.

To reverse the overriding point I made last month: stocks bad, precious metals good.

The first day of August is actually a Monday, so this month’s rebalance date will, in fact, be August 1st. The Mechanical Blend portfolio will likely see some swapping of stocks. The Skunks of the Dow will be changing slightly: CSCO and INTC are out, and AA and MRK are in. The Magic Formula portfolio will be adding GNI and PRSC. The rest of the portfolios should see only simple rebalancing, unless Decision Moose unexpectedly switches out of gold.

Disclaimer: This post is a description of my own forays into investing, offered as general market commentary, and should not be construed as investment advice or the recommendation of a particular security over any other.

Portfolio Comparison: June 2011

It hasn’t quite yet been a month since I began the new portfolio comparison, but it’s nonetheless time for the first monthly update. Because the portfolios were purchased a few days into June, this month’s update covers fewer days than future ones will. Because of this fact, the portfolios probably look slightly better than they would have if they had been invested those few days. However, since months are completely arbitrary endpoints, it’s irrelevant.

I’m compelled to remind everyone that three and a half weeks is nowhere near long enough to make any judgments about the efficacy of any particular investment strategy. Let’s begin this month’s update by looking at just how well each portfolio did, using my traditional “confusing table and chart” approach:

Portfolio Last Month This Month % Chg Total Gain CAGR
Mechanical Blend $100000.00 $105783.41 +5.783% +$5783.41 +135.287%
U.S. Market $100000.00 $102891.18 +2.891% +$2891.18 +54.304%
Magic Formula $100000.00 $102329.74 +2.330% +$2329.74 +41.975%
Skunks of the Dow $100000.00 $101495.03 +1.495% +$1495.03 +25.337%
Sector Flow $100000.00 $101308.24 +1.308% +$1308.24 +21.872%
Savings Account $100000.00 $100065.42 +0.065% +$65.42 +1.000%
Permanent Portfolio $100000.00 $99682.48 -0.318% -$317.52 -4.725%
Caribou $100000.00 $97023.52 -2.976% -$2976.48 -36.862%
Decision Moose $100000.00 $97023.52 -2.976% -$2976.48 -36.862%
Precious Metals $100000.00 $95893.45 -4.107% -$4106.55 -47.173%


As you can see, most portfolios were actually up, unlike my real money portfolios, which were mostly down in June. Here’s a hopefully brief discussion about each portfolio:

  • The best performer this month was the Mechanical Blend portfolio, which managed to select a number of excellent performing stocks. Of course, that 135.827% CAGR is almost certainly going to fall to a more sustainable number before too long.
  • In second place, we find the U.S. Market portfolio, which means that none of the other portfolios managed to beat even this simple benchmark. In other words, the rest of the portfolios may as well be losers, because even a snail could manage to invest in a simple index fund.
  • Three more mechanical stock selection strategies (Magic Formula, Sector Flow, and Skunks of the Dow) make up the next three position, once again reinforcing my thought that stocks were the place to be in June. Of course, they didn’t beat the U.S. Market portfolio, so their stock picking wasn’t incredibly insightful, it seems.
  • Next, we have the the Savings Account portfolio, which earned a paltry $65 in interest. Well, at least it wasn’t negative.
  • The same can’t be said for the remaining four portfolios, of which the first is the Permanent Portfolio. Invested in a number of asset classes, the Permanent Portfolio is supposed to be good for any number of different prevailing economic conditions. In the long run, I expect it to be only slightly better than the savings account.
  • The final three portfolios were all invested in precious metals of some sort, which had a remarkably poor month. Perhaps next month will be a little less bloody.

The overriding point this past month seems to be simple: precious metals bad, stocks good. I suspect the results will be much more entertaining in the coming months.

Since the first Monday of July (today) is actually a holiday in the United States, this month’s rebalance date will actually be tomorrow, July 5th. Few portfolios are changing substantially, with only simple rebalancing scheduled for most of them. The Mechanical Blend portfolio will no doubt shuffle some stocks in and out, but I won’t know the details until the screens are posted. Meanwhile, the Magic Formula portfolio will be purchasing two new stocks: SNDK and BSQR.

Disclaimer: This post is a description of my own forays into investing, offered as general market commentary, and should not be construed as investment advice or the recommendation of a particular security over any other.

Portfolio Comparison: And We’re Off!

Well, the new portfolio comparison is officially underway. As expected, I made the initial purchases for each of the portfolios as of the closing prices on Monday. Each portfolio can now live or die on its own merits.

I do need to make a few brief points:

  • The two stocks chosen for the Magic Formula portfolio this month were ESI and PDLI. I haven’t yet done any research into them, so I haven’t a clue what they do. Part of me wants to keep it that way, lest I find out that they’re all pharmaceutical companies.
  • The five stocks chosen for the Skunks of the Dow portfolio were BAC, CSCO, INTC, MSFT, and WMT. It looks like we have a bank, a retail giant, and three technology companies. My experience with this strategy suggests that it’s slow-moving, so we may see most of these five for quite some time.
  • At the last minute, I added three additional portfolios: Caribou, Sector Flow, and the Permanent Portfolio. Caribou should be familiar to long-time readers of this blog as a model similar to Decision Moose. I may discuss the details of the other two in the future, but for the moment, I want their performances listed in the comparison.

At the end of June, I’ll post an update with the current results. I may or may not figure out something else to post about between now and then.